
Ichimoku Kinko Hyo is a Japanese investing technique. It provides all – trading signals, resistance and support levels. It is very different from normal western techniques such as trading with moving averages, but after a while you should understand it easily. It was created around 50 years ago by Japanese journalist Goichi Hosoda. He started to work on Ichimoku before World War II. To the West, this technique is known from 90s, just like candles it was unknown for many decades.
First, let’s see how Ichimoku is build. Later we will check how it can be used in trading stocks and Forex.
Ichimoku components
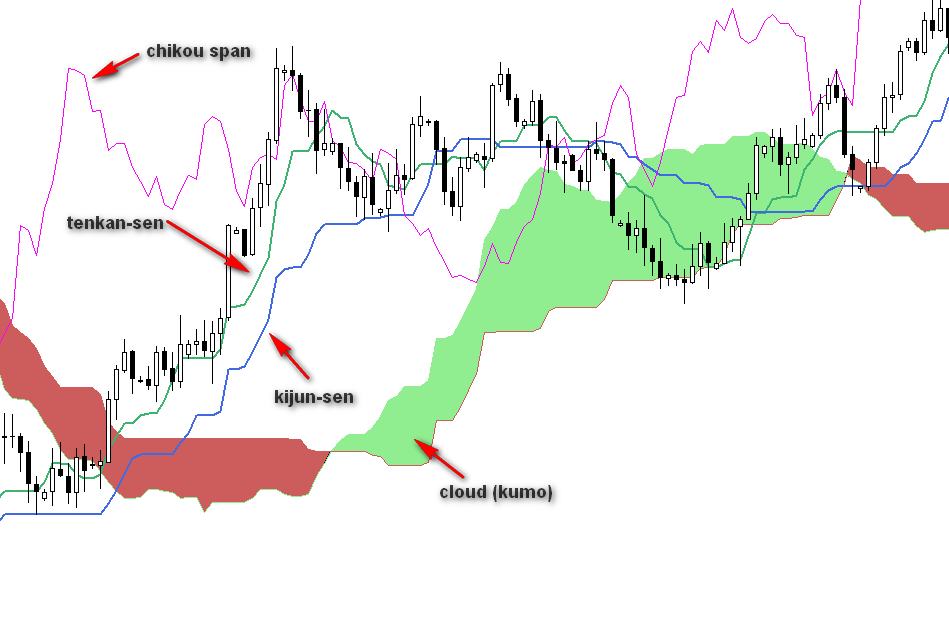
Ichimoku Kinko Hyo is build from 5 averages (notice – these are different averages than standard moving average that you know):
Senkou Span A and Senkou Span B – area between them is called Kumo, or simply just Ichimoku cloud. This is a resistance and support area
Kijun-Sen – longer signal average
Tenkan-Sen – shorter signal average
Chikou Span – this average is shifted back by 26 periods
So when we put this together, we’ve got a ready investing system:
Time to learn more about each component.
Kumo (Ichimoku cloud)
Usually, we look for support or resistance right at moving average or support line. Ichimoku cloud is different – it is area of possible resistance or support. The thicker cloud is, the stronger resistance or support should be at this place. If cloud is thin, than possible support/resistance should be weak:
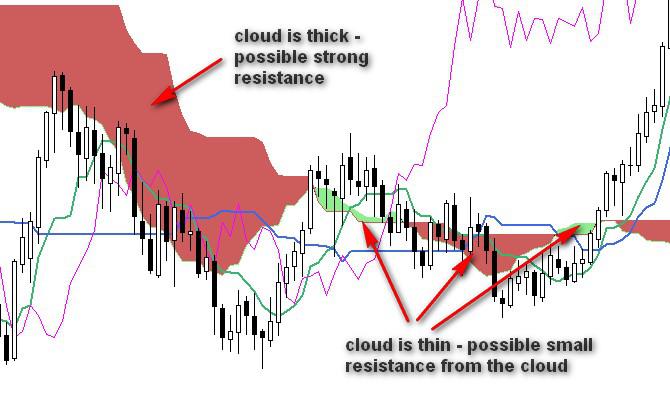
When price manage to break out or break down from cloud, then this is a strong signal to take position, because it happens rarely:

Kijun-Sen
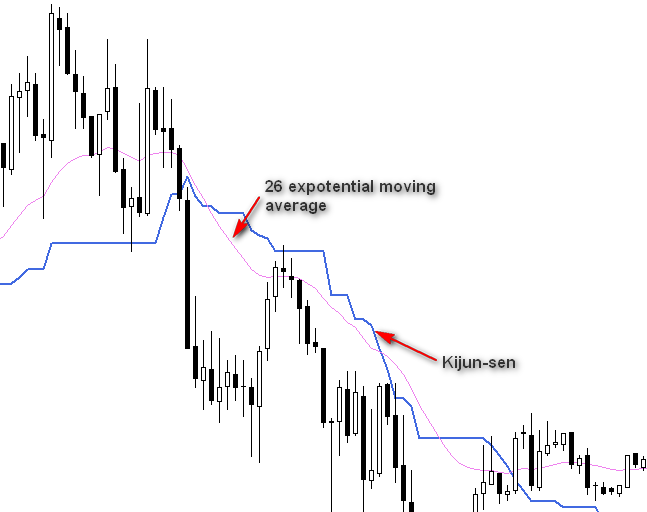
It is longer average, based on 26 periods. Let’s compare Kijun Sen and 26 moving average. As you can see, it acts different.
From my experience, I can say that Kijun Sen itself is a good resistance/support level.
You can compare Kijun-Sen with normal moving average:
Tenkan-Sen
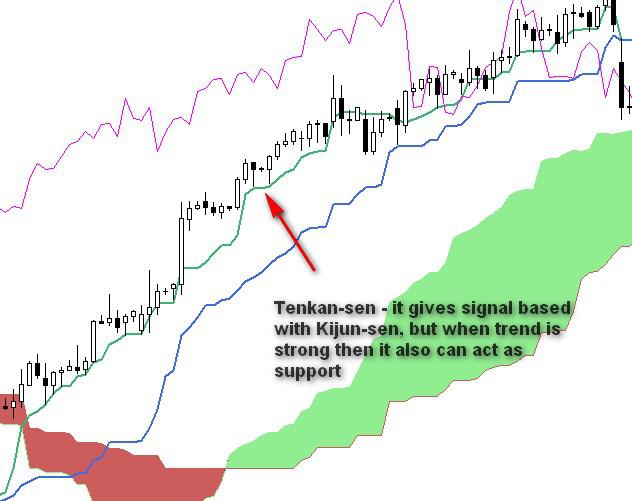
It is shorter average. Based with Kijun Sen it gives signals to buy and sell (more on that later). When trend is strong, it can also act as support/resistance.
Chikou-Span
The main idea behind Chikou Span is that it helps to compare current price with price from 26 periods before. The end of Chikou Span is the current price close. Based on that we know if the current sentiment is bullish (Chikou Span above price) or bearish (Chikou Span below price).

Ichimoku trading signals
We have few types of trading signals from Ichimoku based on Tenkan-Sen and Kijun-Sen cross.
There are also signals to open a trade when price break from the cloud. You will see all that in the examples and it should be clear.
Ichimoku trades examples
First, to get more comfortable with Ichimoku, let’s start from higher time frames, which are easier to
read and trade.
I like to invest with Ichimoku in longer time frames. It is great when you look for entry point, not so great when it comes to exit, but we will also deal with that.
What I look on chart is mostly breakout from cloud. For me this is the best signal from all you get from Ichimoku. I check history, few years back, to see how price reacted around cloud. Were there many good signals after cloud breakout? Sometimes price action for current stock is so specific that this does not work so well. Then I move to another stock. When history confirms that price works well with cloud, I make decision or not. I place stop usually below cloud.
Sometimes price is already above cloud and trend is getting stronger. Then I look at Kijun Sen and Tenkan Sen. If Tenkan Sen is above Kijun Sen, I have a confirmation of uptrend. Then I like to look for breakout from resistance. Drawing resistance and support lines is very important here. Remember – it is weekly chart so if there is a resistence line, say, from top from six months before, there is a big chance that price will respect that resistance. If it manages to breakout, then it is a good signal to go long. So in that case Ichimoku is like a background, but important one.
Adobe stocks, monthly chart
I do not follow signals blindly. So when there is a breakout from cloud, I check other things. Most important for me are trend lines. Monthly chart of Adobe is a good example. We had two breakouts from cloud which failed because of resistance lines. Finally price managed to breakout from cloud and resistance lines – this was a perfect moment to go long.
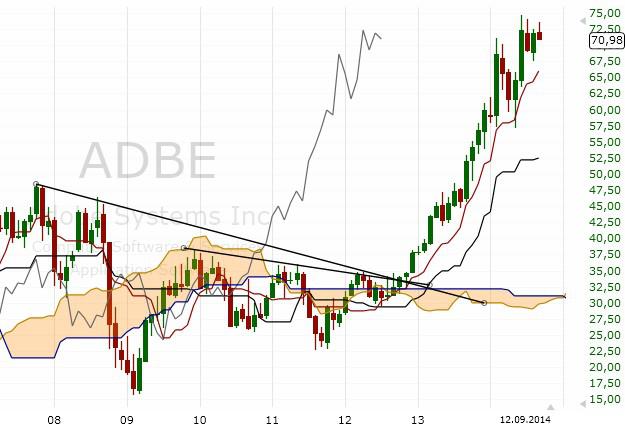
7.1. Long trade on break above cloud and resistance lines
If trend is strong, then price is above Kijun Sen. This is my stop loss. I do not wait for Tenkan Sen and Kijun Sen cross to close position because this signal comes on most cases too late. Other technique you can use is to set stop loss below recent low. This will be your exit point.
City stocks, weekly chart
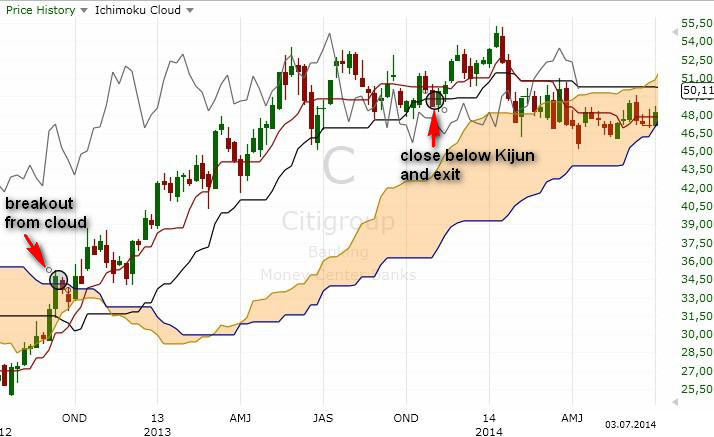
7.2. Break from the cloud
This is a little to perfect example of trade. I use very often breakout from cloud as signal to enter. In this example we saw a long breakout and price went up above 50$. Exit place was when price closed below Kijun Sen. It is not always that easy but it is rather a good example of potential this signal has.
Electronic Arts stocks, monthly chart

7.3. Adding oscillators to help decide if breakout is valid
Problem with breakouts from cloud is that you may see some false breakouts. In the chart above the first long breakout was false, the second one was correct and trade should be closed above Kijun Sen.
You can try to add another condition to the breakouts from cloud. In this example, we used Williams %R to filter breakouts. The conditon is simple – %R should be in oversold or overbought area to enter trade.
On the right side we can see that it looks like another trade opportunity, with breakout from cloud and %R in oversold area.
EMR stocks, monthly chart

7.4. Example of different breakouts
This trade worked great – long at cloud breakout and close below Kijun Sen, but… You can see on the left and right side that there were some breakouts, which did not bring strong trend. I would not call all of them false. Some worked out, but with smaller range of moves. That is why it is so important to manage wisely your stop losses.
ROST stocks, monthly chart

7.5. Signal to go long (break from cloud), stop loss would be below cloud
When cloud is thin, I place stop loss below cloud. In this case we took the first long breakout and set stop loss below cloud. Move up did not start rigth away, but ROST hold above cloud and is going up strong.
COP stocks, weekly chart

7.6. Open and close position based on Tenkan and Kijun lines
Sometimes the trend is strong and price will be far away from cloud, so no signals from cloud breakout. When you see a situation like that, you may use breakout below or above Kijun Sen as a signal.
First trade – after correction price returned above Kijun Sen (black). We got signal to go long. An exit was here below Tenkan Sen because we spotted that price is most of the time above Tenkan and Kijun is far away.
Second trade – same scenario. A long breakout above Kijun Sen and close below Tenkan Sen (because Kijun Sen was too far).
Ichimoku and Fibonacci Forex trading strategy
I hope that now you understand Ichimoku pretty well. I like to join Ichimoku with Fibonacci lines. Why? Ichimoku gives me a look at current situation. It can also give us a signal to take positions. So in short:
- I open position based on Ichimoku and Fibonacci retracement lines
- I exit position based on Fibonacci extension lines
I prepared some examples and it should be clear how to join these tools.
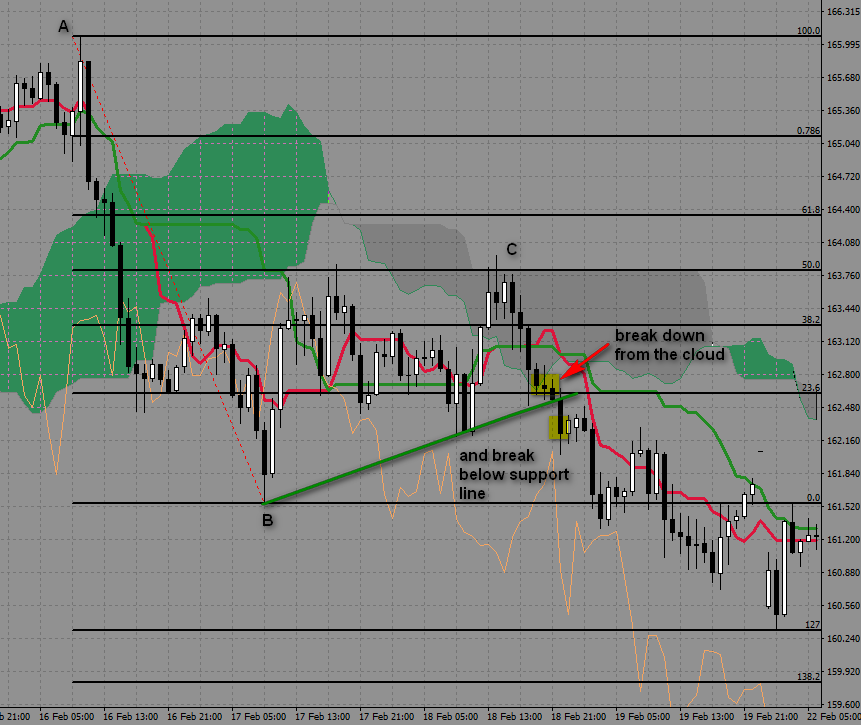
USDJPY, 1-hour. Correction to the cloud and break from cloud
This is an example you will see many times. Move from A to B, then correction which goes inside a cloud.
Break from the cloud is a good Ichimoku signal. If price breaks out above the cloud, then it is a buy signal. If it breaks below cloud, it is sell signa.
In this case, after correction to C – 61.8% (inside cloud) we saw a break down from a cloud – a signal to sell. Also, there was a break below Kijun line – another bearish signal.
This was a start of a stronger move down.

8.1. Break from the cloud as a trading signal
USDJPY, 1-hour
Another example when there is a correction to the cloud and after that a break from the cloud and signal to sell.
If it is not a range move then this signal works pretty well.

8.2. Ichimoku and Fibonacci – example
GBPJPY, 4-hour
Sometimes the cloud is far away from price. In the example below, we can see that C (61.8%) was away from the cloud.
After cloud, our next indicator of possible next move is a break through Kijun line (green).
OK, so we didn’t have a break from the cloud, but there was a break below Kijun-Sen.
Again. When a market is not in a range, this is a good indicator od possible price move. Indeed, in this case, it was. After a break below Kijun, we saw a strong move down.

8.3. Use of Kijun-Sen as an entry signal
GBPJPY, 1h, part-1. Kijun-Sen as trailing stop
Kijun-Sen is a great indicator even left alone. We will see that in this 2-part example.
Let’s start from entry.
ABC move. C was at 50% retracement. We saw some range move below 50%. Price entered a cloud and later there was a break down from a cloud – a signal to go short.
Of course, in this case, we could wait for a break below the green trendline.
This was a good entry, with help of break from cloud which I described before.
8.4. Part 1 – short position after break from the cloud
GBPJPY, 1h, part-2. Kijun-Sen as trailing stop
Now we have an open trade which is profitable and there is one question. Where to exit?
I wrote later that I like to close my trades in parts. Sometimes you see so strong trend that you start to wonder – close at extension or wait?
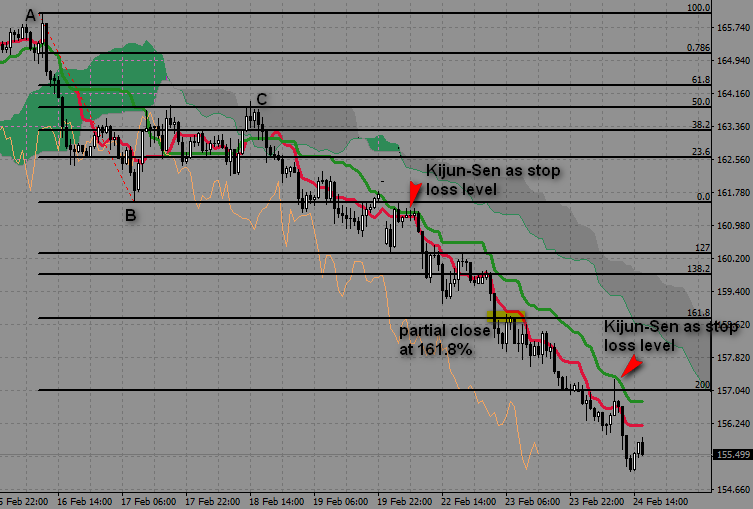
8.5. Part 2 – Kijun-Sen as trailing stop
I always close part of my trade at 161.8%. This is very popular level were many traders do the same. Still, if a trend is strong you can use Kijun-Sen as a help. Kijun often works as a resistance. In this example, we saw that during a correction Kijun acted as a resistance. A clear signal to place trailing stop loss above Kijun. Thanks to that single Ichimoku line we could catch a hefty portion of a move.
TD stocks, weekly chart
On weekly chart, we can spot easily ABC move. Correction stopped at 50% retracement and we saw some activity from bulls. When to enter? I left Ichimoku on chart. On higher time frames price rarely crosses with Kijun-sen. When it managed to close higher than Kijun-sen, it was a good entry point. Later there was a nice, strong move up to the 161,8% extension line. Does it mean that this move ends here? We do not know that. We only know that this is a good place to close position.

8.6. Strong move down to the 200% extension
Remember – it is a weekly chart and still we can pinpoint exit point with good precicion.
Using Ichimoku Kinko Hyo Monitor
Ichimoku is great in long term trading, but you can also use it in short term trading. The problem is that Ichimoku is rather complex (we have signals from Kijun, cloud etc.). Add to that fact that we have to check the situation on other time frames. It may be tough for someone new in Ichimoku. Even for me, it is not easy when I scan many pairs.
I included to my trading with Ichimoku an indicator called ichi360 Monitor. It is not written by me. Few years back there was a very good blog ichi360.com about trading with Ichimoku. The blog is not around anymore, but author (who was also a programmer) shared some indicators on his site. To this day, you can find them on various FX forums.
Ichi360 Monitor is very cool little indi. It looks like that:

8.7. ichi360 Monitor on chart
We are interested in the lower part:

8.8. Situation on all timeframes
We can see situation on all time frames from 1m to weekly. The shortcus are:
PA – price action, is price going up or down
P/K – price to Kijun-Sen
T/K – Tenkan-Sen to Kijun-Sen
CS – Chikou-Span
C/K – Cloud vs Kijun-Sen
C/C – Cloud vs Chikou-Span
Bund, 4-hour
Take a look at this 4-hour Bund chart. Thanks to the ichi360 we know that on all time frames situation is bullish. Also, we had a buy signal from Ichimoku and, of course, a nice looking ABC Fibonacci pattern. It looks good and should be a good long trade.
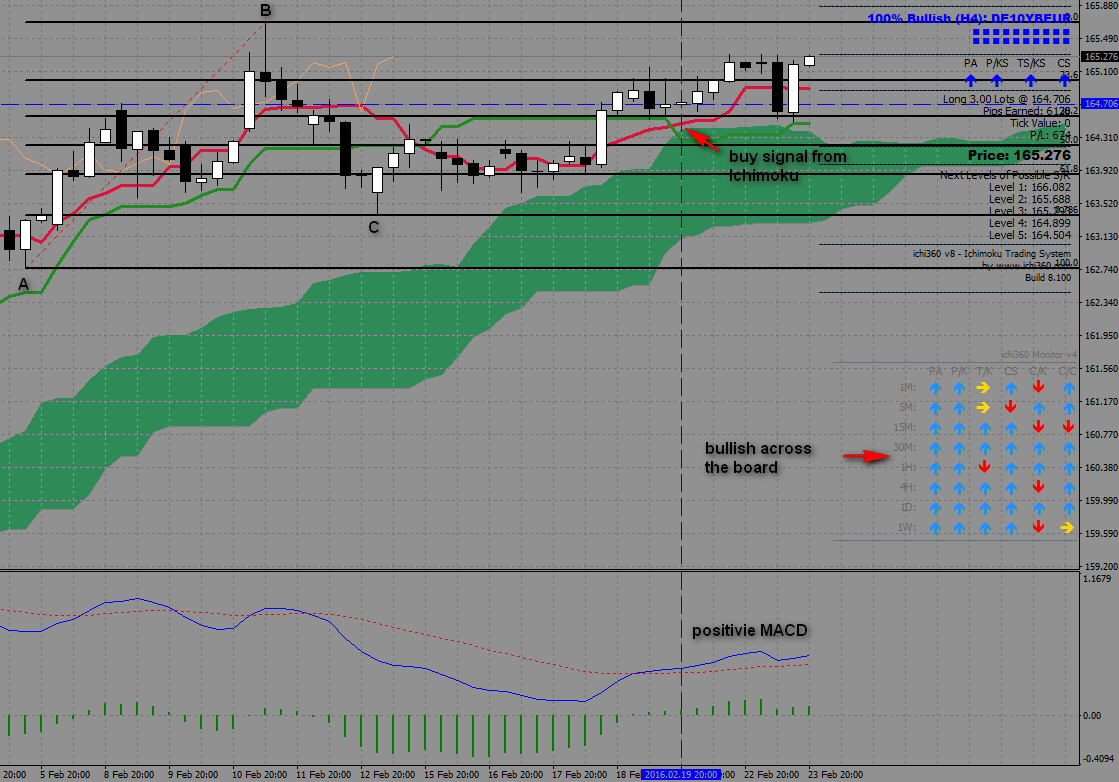
8.9. Long trade with help from ichi360 Monitor
NZDJPY, 4-hour
Let’s take a look at more complicated example. NZDJPY on 4-hour chart was in a range move, but it was clear that ABC pattern is in place. Also, there was a resistance from cloud and resistance line. From ichi360 we knew that situation is bearish. If we would enter in that moment then we should wait for a break below temporary support line marked on the chart.
Stop loss would go above the cloud.
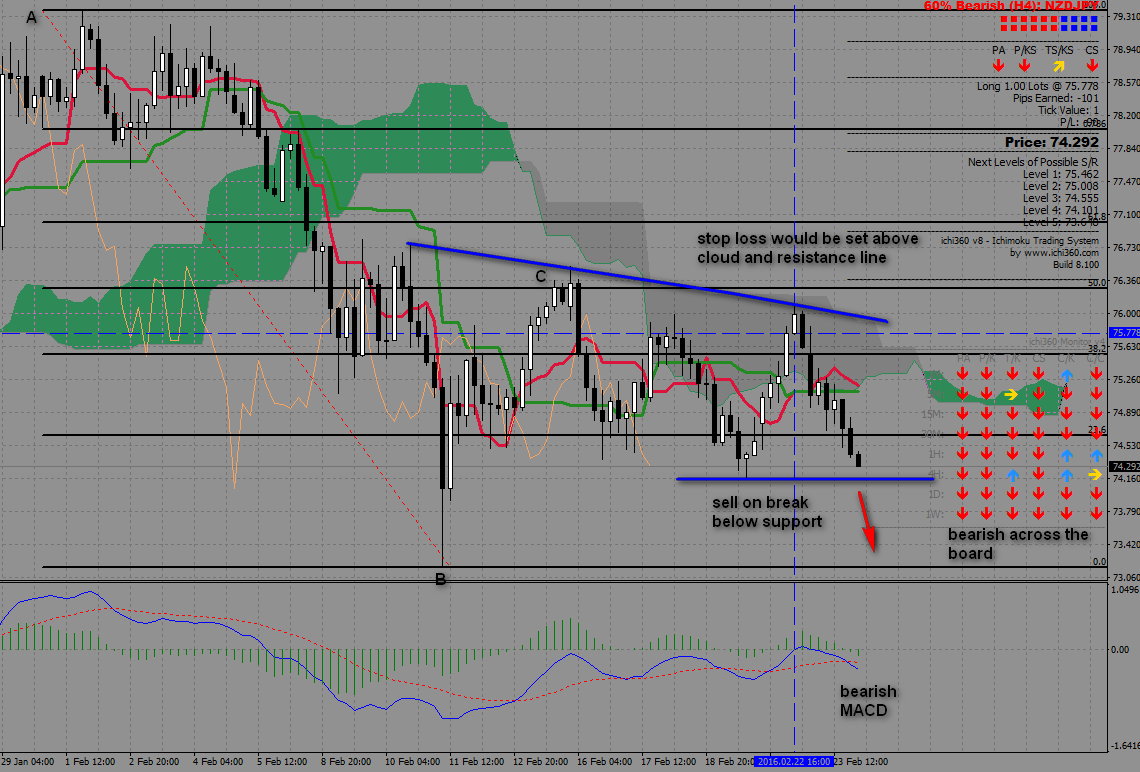
8.10. Short trade. Ichi360 Monitor shows bearish situation on other timeframes
AUDUSD, 15m
The situation is not clear on all time frames, but we are on 15m and it is a downtrend. Also, 30m and 1h are down. After correction to 78.6% price started to move down. There was a sell signal from ichi 360 and moment later a confirmation from MACD. A good entry point.
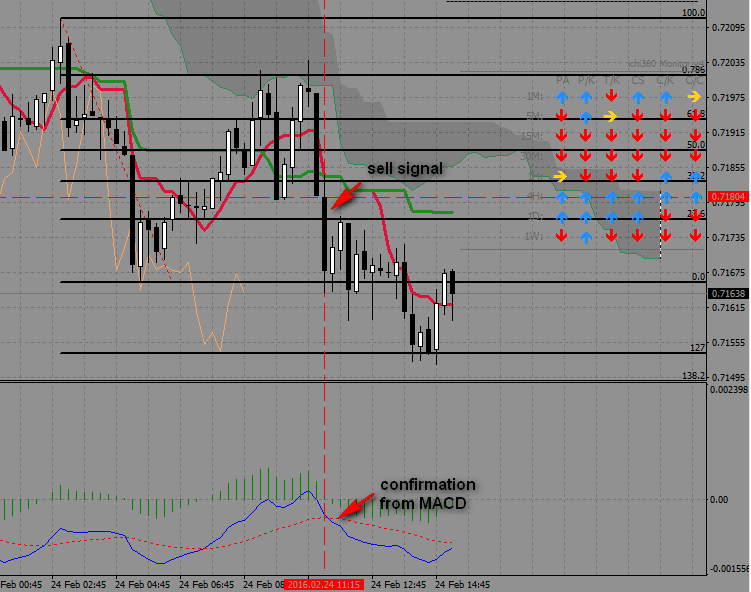
8.11. Mixed situation, but downtrend is also on higher time frame
USDJPY, 30m
We had a signal from ichi360, but price was above a recent low. We should wait for close below that level (green support line) and then enter short.
You can see in the right top corner that situation was bearish on all time frames. Good trading conditions for short.

8.12. Sell signal from Ichimoku


Merci Simon.
Hakim de Bordeaux – France.
thanx a million. very useful.
appreciate the attitude to help other people make money.
Hi Simon,
where I can get the Ichimoku Kinko Hyo Indicator / EA ?
It looks interesting to try.
Cheers
Hi Claudio.
It is rather popular indicator and it should be built in your trading platform. If you can’t find it try to google “ichimoku + name of your trading platform”.
If you will still have problems, contact with me and I will try to help.
Hi Simon,
At the outset I must Appreciate your time and effort for writing this fine article it shows you are really tech savvy.
Can I ask you a favor?
Please tell me few sites which offers to practice trading with ichimoku on chart freely i.e as a paper trading.
Thanks and Regards
It repaint the signal – any way to solve it?
No. It is working like moving average. Signal can change until price is close. You can simply wait for close.
thanks so much for sharing!
if we put a small time frame, do we still need to confirm a larger time frame?
what if the Ichimoku for scalping does this work?
always confirm situation on larger time frame 🙂
I personally don’t think that Ichimoku is good for scalping on lower TF, you have to test it by yourself. Maybe you can build a good trading plan around it.
Hi Simon, Thanks a lot. Hard to find details abt Ichimoku in simple manner. I’m using 1Hour TF in commodities. It works well.
Yes, Ichimoku works best on higher time frames like 1h, 4h, daily… I do not recommend to go lower than 1h with Ichimoku.
Hi Simon,
Which time frame do you use Mr Ichimoku on?
I trade with Ichimoku mostly on higher time frames like 4h, daily, weekly