
This was another interesting week. Lets see some interesting situations and trade opportunities.
GBP/JPY
My focus is on GBP/JPY. After Brexit decision we can see that down trend is moving even faster. Especially 30m chart is interesting. You can see that 55 and 200 averages worked as support and resistance for this pair. There was a squeze between them and later a strong move down. So yeah, this were two ideal places to take another short position:

If we switch to higher timeframe (1h) we can see that this was a clear ABC pattern with correction up to the 50% Fibonacci retracement:

EUR/USD
Situation here is not that clear. When we look at Ichimoku on daily chart we can see that cloud is a resistance for price. So we have a downtrend in place:
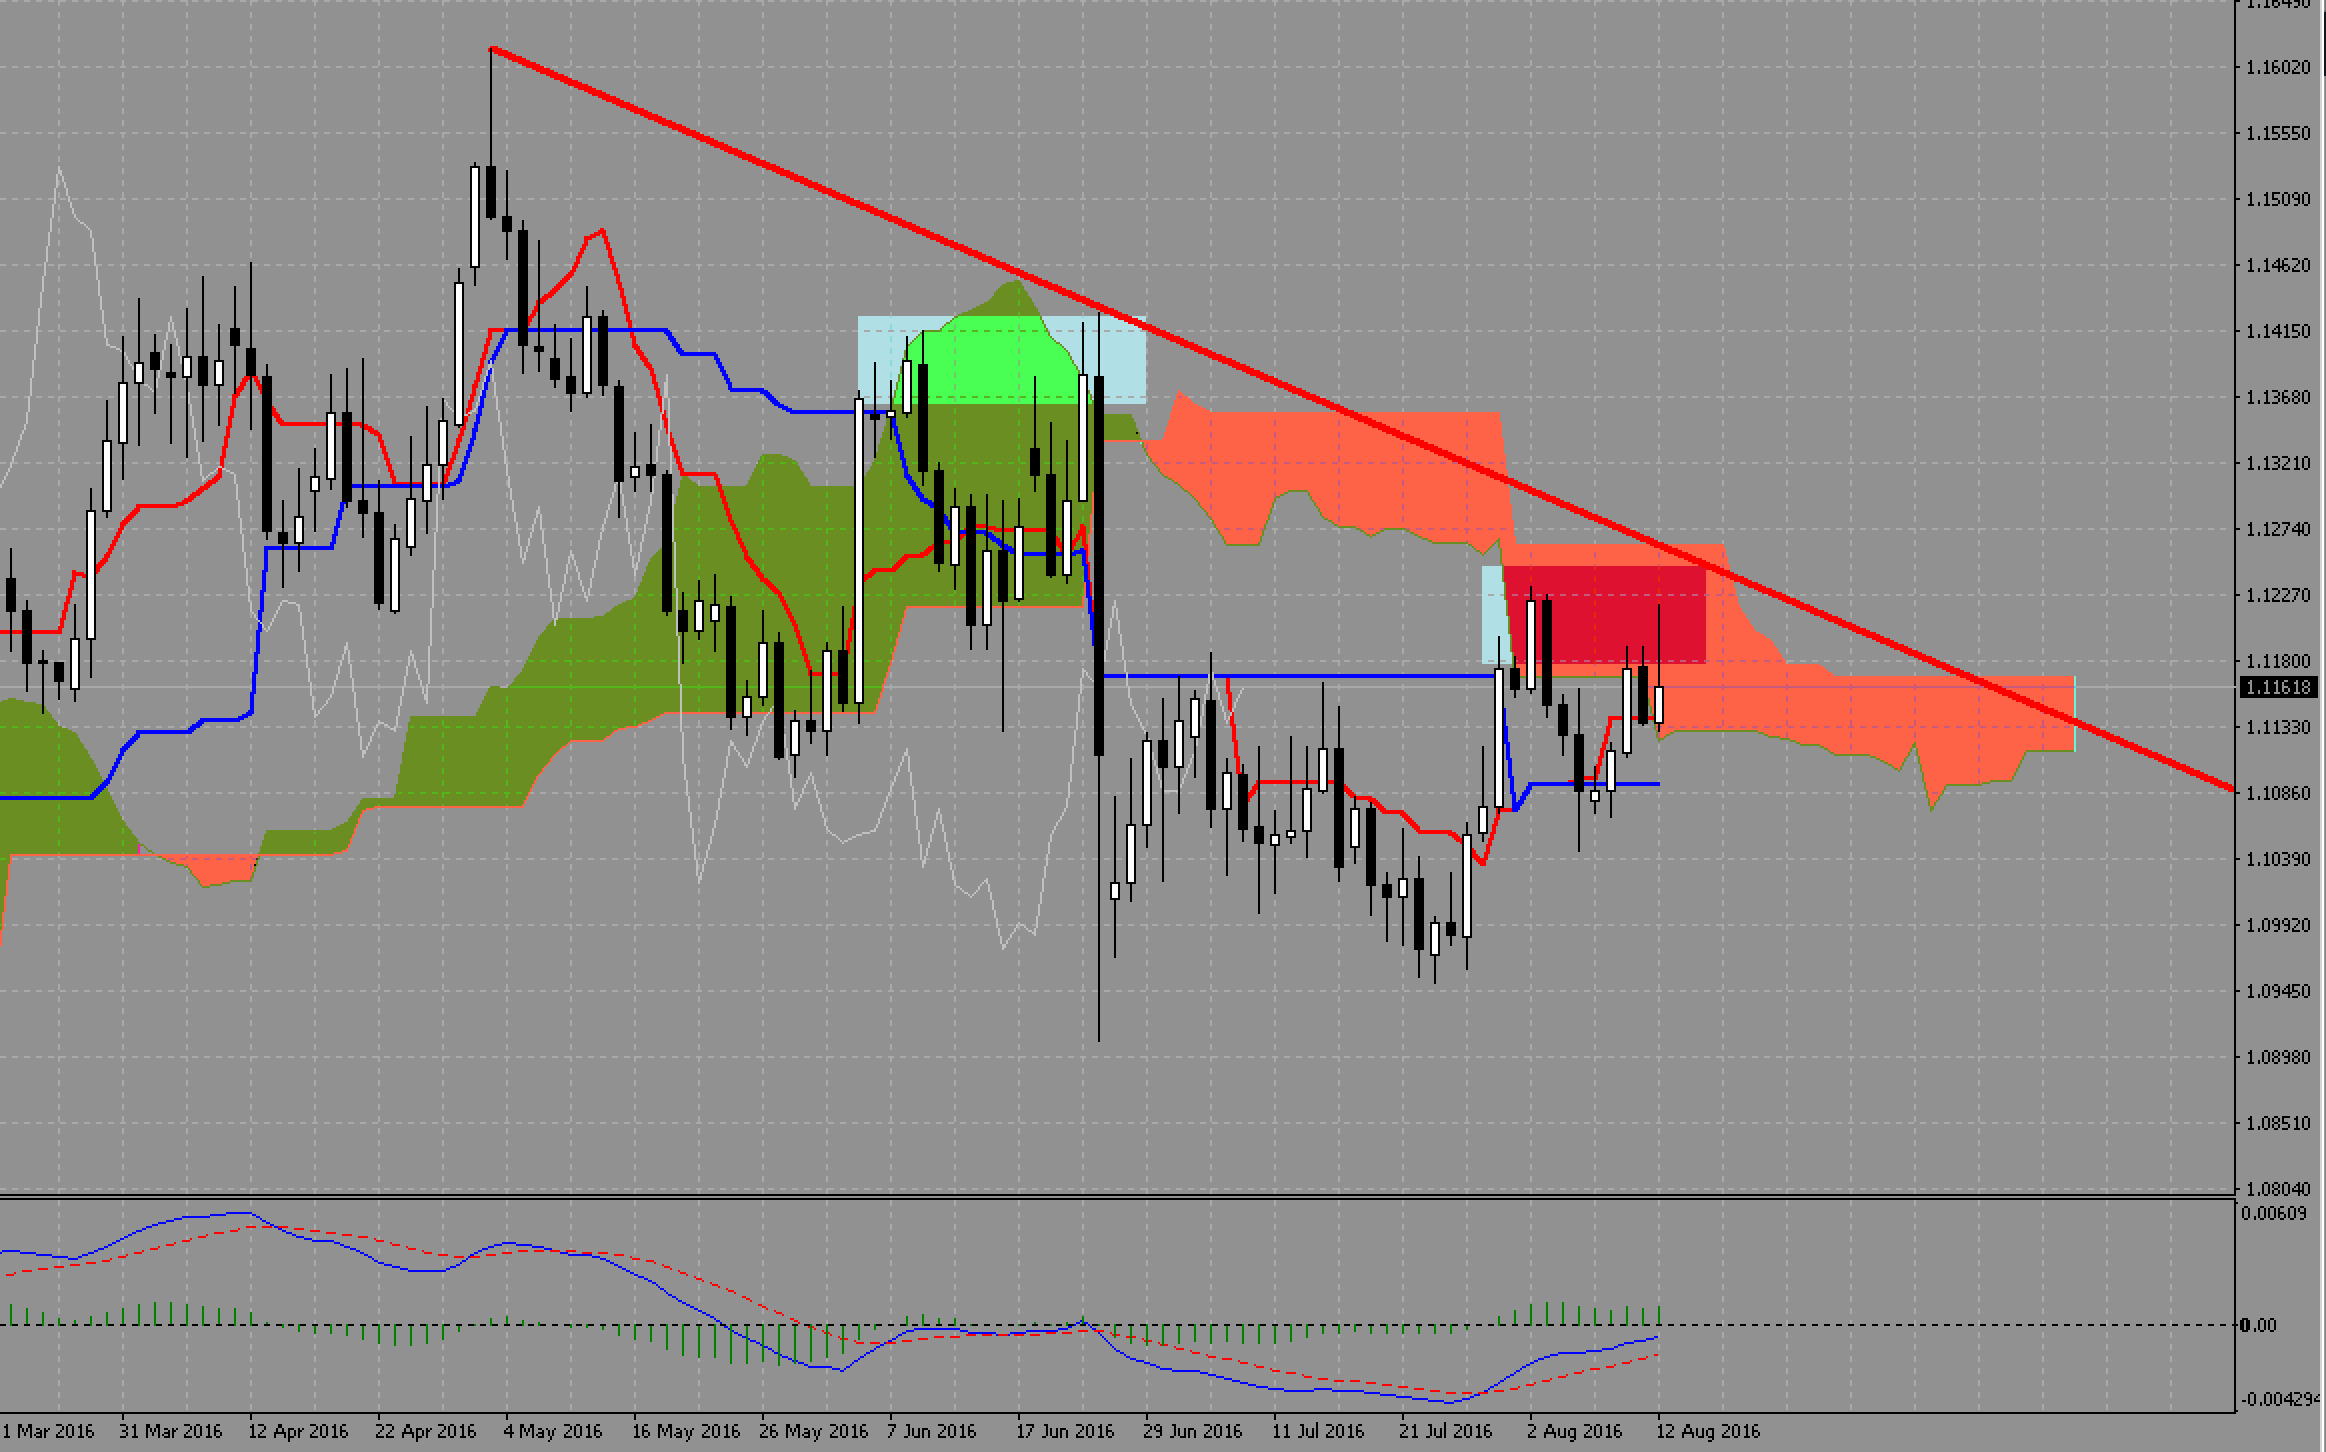
but…
If we check higher Ichimoku timeframes, we can see some sings of correction. Take a look that basically since March Eur/Usd was trapped inside the clound on weekly chart. Only recently in managed to break above the cloud but you can see resistance lines (red resistance line, Kijun line…).

So this is why it is little confusing in this pair.
AUD/USD
This pair is clearly trapped below 61.8% retracement and 100 MA on weekly timeframe.We can also draw a triangle there. So we will see if price can break above that resistance area or if we will see a continuation of move down:


