
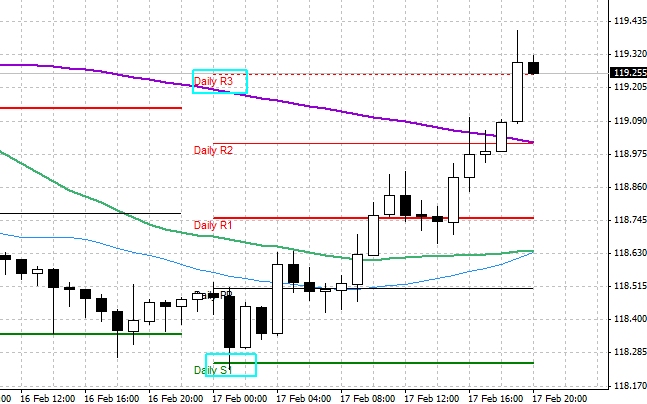
We saw today a nice trend on usd/jpy. Pair moved first to the 118.24 (low) and from there started to rally. In the end it was a move from daily S1 support up to the daily R3 resistance which is rare. Below usd/jpy on 1 hour:
On lower time frames such as 5, 15 min. we had a nice trend and easy ABCD setups. First after retracement to the 50% line there was a move up. Price closed above 200 SMA (red) which was a sign that bulls are strong. Move ended at 161.8% extension. Below first trade opportunity on 15 min. chart:
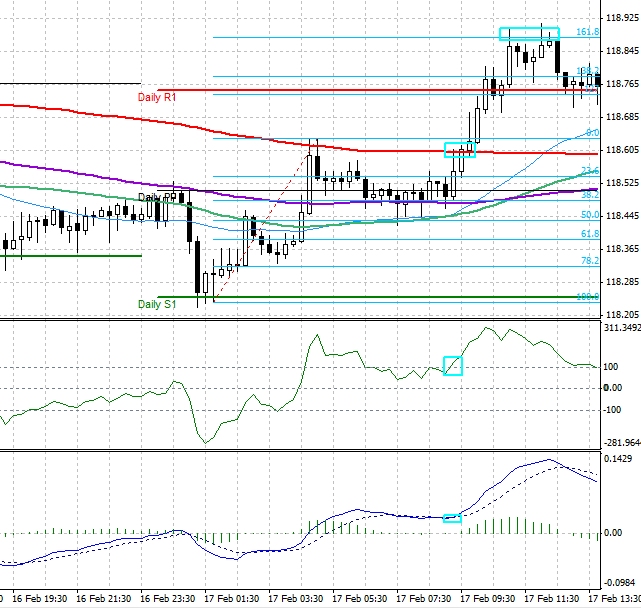
Later usd/jpy retraced again to the 50% line and turned up. We saw some signals from CCI and MACD. There was a R2 resistance but usd/jpy closed above that level and move stopped at 138.2% extension but only for a moment. In the end price exploded again up to 200% fibonacci extension line, way above daily R3 line. Below this trade on 15 min. chart:

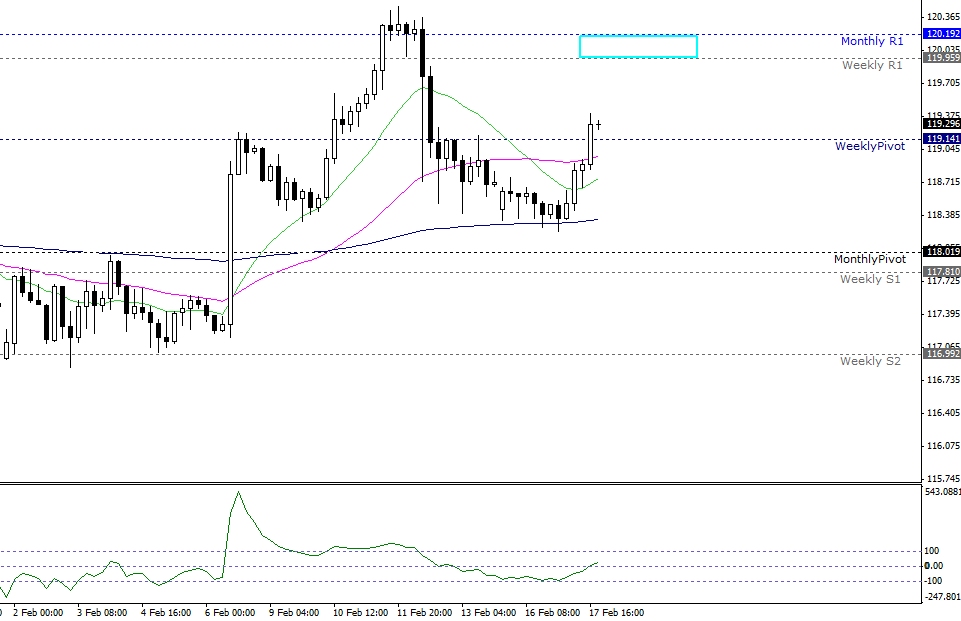
On Wednesday might not be that easy because there is a Bank of Japan monetary policy meeting. Just in case watch weekly and monthly pivot points. Around 119.95 and 120.19 we have a weekly R1 and monthly R1 so this might be a place of strong resistance. Usd/jpy 4-hr chart with weekly and monthly pivots:
Oil gained some momentum. It looks like move up to 64-66$ is possible. Oil on 4-hour chart:


