
Every trader is familiar with basic moving averages such as:
- Simple Moving Average (SMA)
- Expotential Moving Average (EMA)
- Linear Weighted Moving Average (LWMA)
- Smoothed Moving Average (SMMA)
SMA and EMA are the most popular one. They work nicely in a stock market, but in faster markets (or lower time frames) they tend to lag. That is why traders kept on improving averages and that is why we can use other types of averages. DEMA is one of them.
The double exponential moving average (DEMA) was developed by Patrick Mulloy to reduce the lag time. It was first described in 1994, in the Technical Analysis of Stocks & Commodities magazine in Mulloy’s article “Smoothing Data with Faster Moving Averages”.
DEMA can also be used in indicators which are based on moving averages (MACD, Bollinger Bands, others).
Differences between DEMA and other averages
Let’s take popular pair of 21 and 55 expotential averages:

6.1. 21 and 55 EMAs
And pair of 21 and 55 double expotential moving averages:
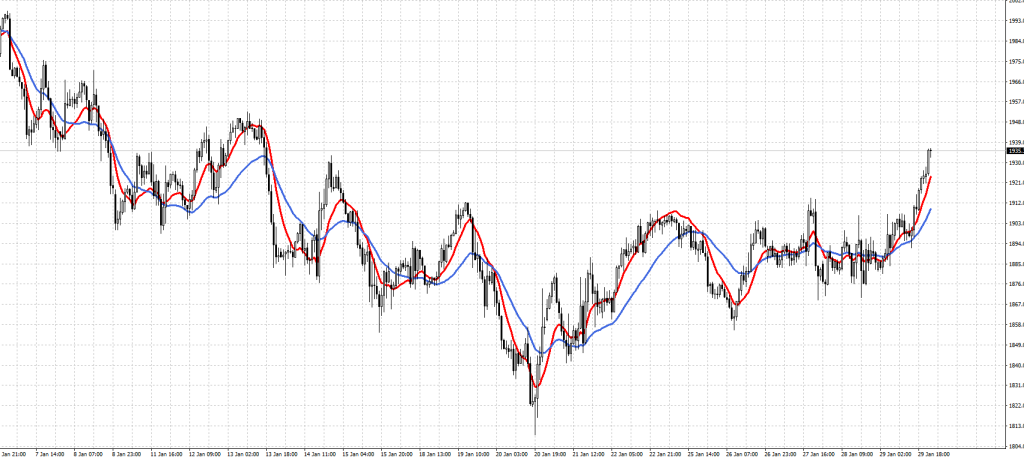
6.2. 21 and 55 DEMAs
You can see that DEMA averages follow price more closely.
What is great about DEMA is that it gives better signals. I use mostly 13 and 55 DEMA averages and 100 SMA. Cross of 13 and 55 is a signal to enter a trade. In my opinion, that combination works best on 30m and 1h timeframes.
GBPJPY, 1h chart

6.3. Short position opened after DEMAs cross
There was a confirmation on higher timeframes that the trend is down. We spotted an ABC pattern. Take a look how 100 SMA worked as a resistance. It was easy to expect that if there will be a continuation of move down, we might see a correction to retracements near 100 SMA.
Later there was a cross of 33 DEMA and 55 DEMA – a signal to go short. Move down lasted to the 200 extension line.
GBPJPY, 1h chart
Of course it is not always that clear and easy. There will be situations that you will open position based on signal, but there will be no move down, only sideways. Like in the example below:

6.4. Example of false breakouts
You can see that the whole action took place below 100 SMA. OK, trend was down, but after signal from 13 and 55 DEMA to go short, we saw many false breakouts. You are not able to predict these things. The most important thing is to have a plan and do not overtrade. The worst thing you can do here is to open short, close, open on another signal, close with loss, open again… You open a position once, set stop loss and wait how this will play out. In that case my stop loss would be above C point. Later, if a price would close for longer above 100 SMA I would probably close trade there.
So, to sum up. Sometimes you will have false signals because of sideway move.
It is important to not overtrade. Place trade, set stop loss, wait and observe. Do not overreact.
EURUSD, 1h chart
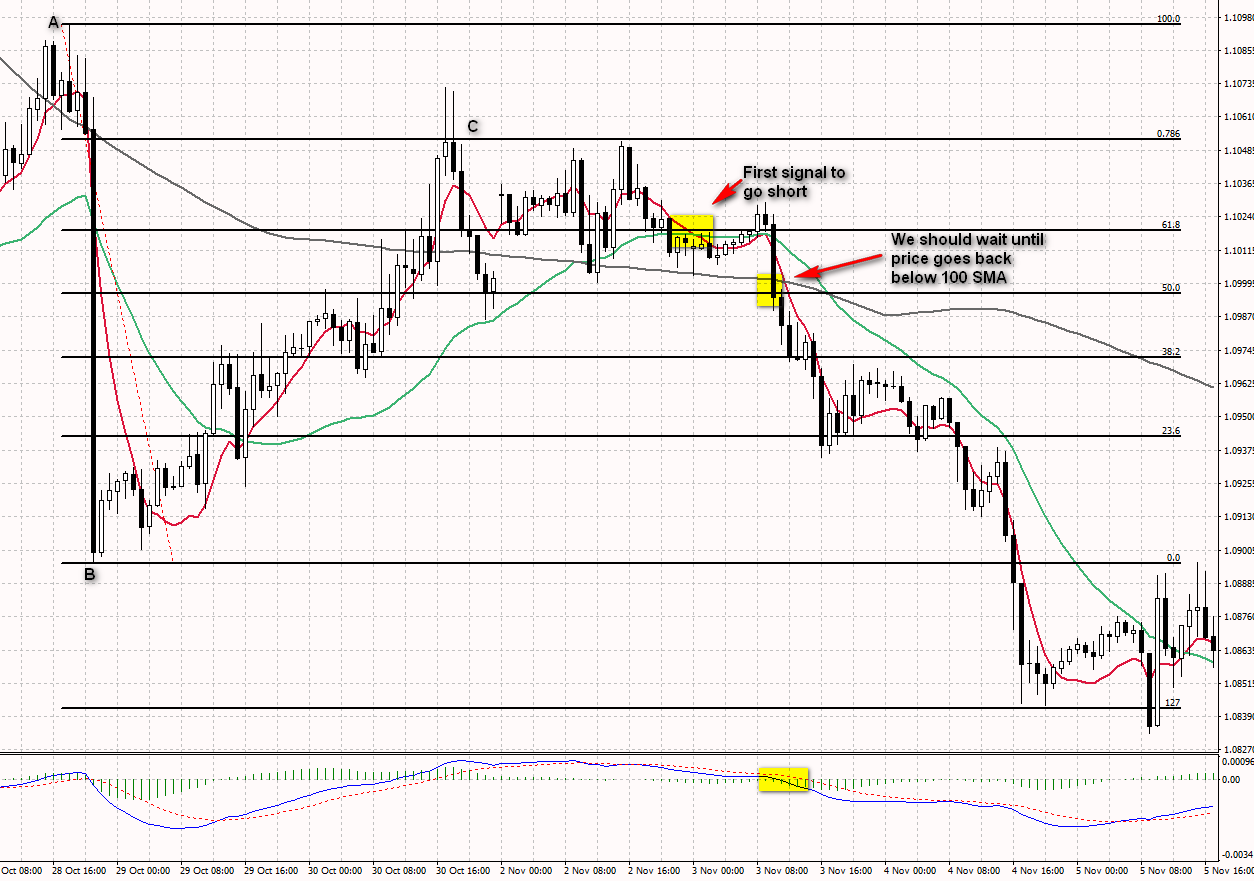
6.5. 100 SMA as a part of trading system
In this example during correction up rice went above 100 SMA. There was a signal to go short from 13 and 55 DEMAa, but you should wait until it breaks back below 100 SMA.
Remember that also, in that case, we have a confirmation from higher timeframes that trend is down.
EURUSD, 1h chart

6.6. Late signal example
Sometimes (but rarely) you may see that signal is lagging. Like in the example above. If you are sure about your ABC pattern, then you can open a position based on break above/below 0 line (so simply breakout from ABC).
You can use shorter periods of DEMAs if you think signal is too late. For example, you may switch to 10 and 21.
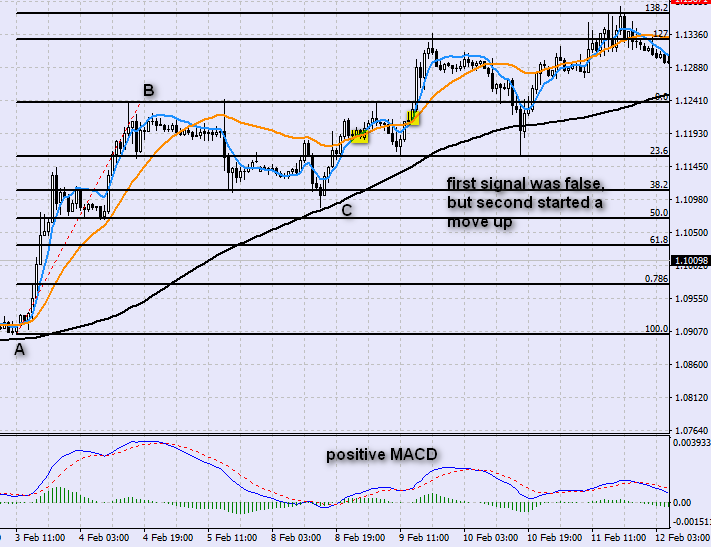
EURUSD, 1h chart
Here, after AB move, we saw a correction to C. It ended above 100 SMA and 38.2% retracement worked as a support. Later we saw a cross of 13 and 55 DEMA – a signal to go long. The first signal was false, but we stayed in a position with a stop below 50% retracement.
Few hours later there was another signal and then price went up.
I mentioned it before – it is important not to overtrade. You open position, set stop and observe.
6.7. EURUSD trade example
EURUSD, 1h chart
You can’t follow signals blindly. In this case, we saw a cross of 13 and 55 DEMA below 100 SMA.
It was a signal to go long (from 13 and 55) but MACD was still negative in that time, also price was below 100 SMA. If you are not sure about signal, it is ok to wait and look for another confirmation. In this case MACD turned positive and price went back above 100 SMA.
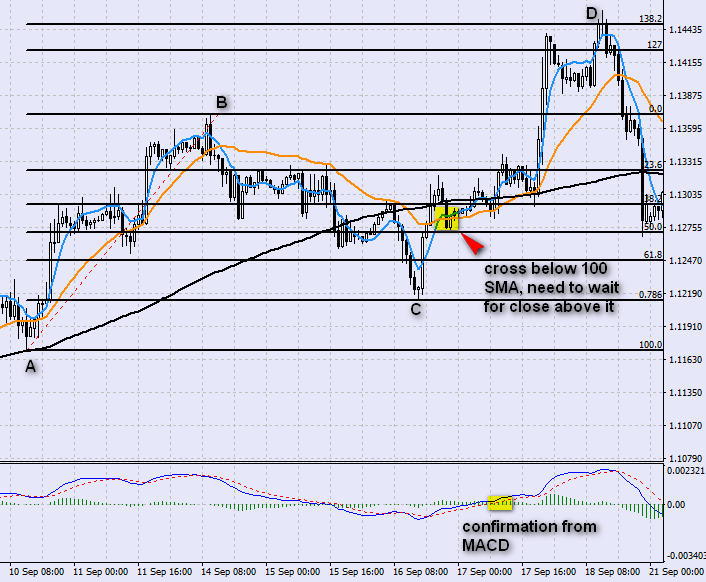
6.8. Another example when it was best to wait for confirmation from 100 SMA
SPX, 15m chart
One more example when it was best to look for signal confirmation. The first signal to sell from DEMA lines was false – there was no confirmation from MACD.
Few hours later there was another signal from DEMA cross and there was a confirmation from MACD. It was a good entry point.

6.9. Confirmation from MACD
Using Dema indicator
You remember from chapter Going in the right direction that you should always check other timeframes to have a clear situation what is going on. Only sometimes it is hard to switch between timeframes when you scan more than few forex pairs or other instruments. That is why I wrote a simple DEMA indicator. It shows situation on other time frames. You can see two columns: DEMA and Trend:

6.10. DEMA indicator
DEMA column indicates if 13 is higher than 55. If is higher you can see Up sign. If 13 is below 55 DEMA than the sign says down.
Trend column show results for 13 DEMA and 100 SMA. If 13 DEMA is above 100 SMA, trend is up. If is below, trend is down. Why 13 DEMA and 100 SMA? As I wrote before, I put high weight on 100 SMA as a support/resistance and trend indicator. 13 DEMA stick close to the price so if 13 DEMA is above 100 SMA then it is an uptrend. Of course, you can have your own definition of an uptrend. I was looking for something simple to implement and I am happy with that choice.
You can see now that it is enough to have a quick look at indicator to see if trend is up or down. It is very helpful with scanning. Remember that it doesn’t mean that you don’t have to check other time frames. The goal of this indicator is to help you chose the best candidates. When you narrow your list, you have to manually check other time frames.
Let’s look at some examples.
GBPJPY, 30m

6.11. DEMA indicator in practice
After a correction to 38.2% price turned up and 13 DEMA crossed with 55 DEMA. We are on 30m chart, situation here looks bullish. What about other time frames? You can see on indicator that from 5m to 4h there is an uptrend. So it should be ok to go long.
EURUSD, 15m:
In this example we can see that on daily and weekly trend is up, but we are looking for a trade on 15m chart. As we check other timeframes, it is clear that current trend is down.
With that knowledge, we can look for a short opportunity. And there it is. After ABC move, EUR/USD stays below 100 SMA. First signal to sell was false, but second one started bigger selloff.
As marked on chart, best place for stop loss would be above red resistance line or eventually above 78.6% retracement.
It is not possible to find perfect trade condition every time (so the whole board in one color). Still, if on nearest time frames we can see the same trend, then we should be good to go.
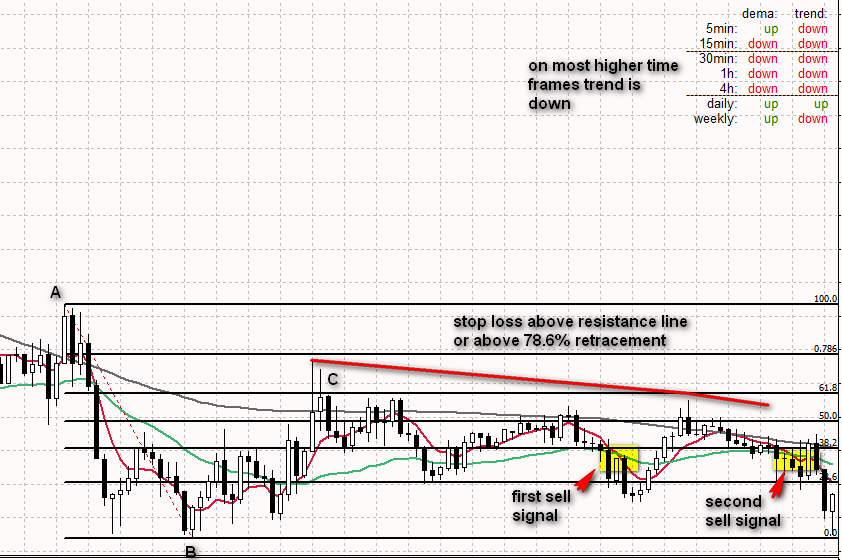
6.12. DEMA indicator shows us a situation on other time frames


nice, thank you very much for the article!
Where can I find DEMA?
Here: https://fibotrading.net/forex-indicators/dema-moving-averages/