
There are few solid strategies you can use when you want to trade Bitcoin and other cryptocurrencies. In this guide, I present you some ideas you can use in your trading.
Moving Averages
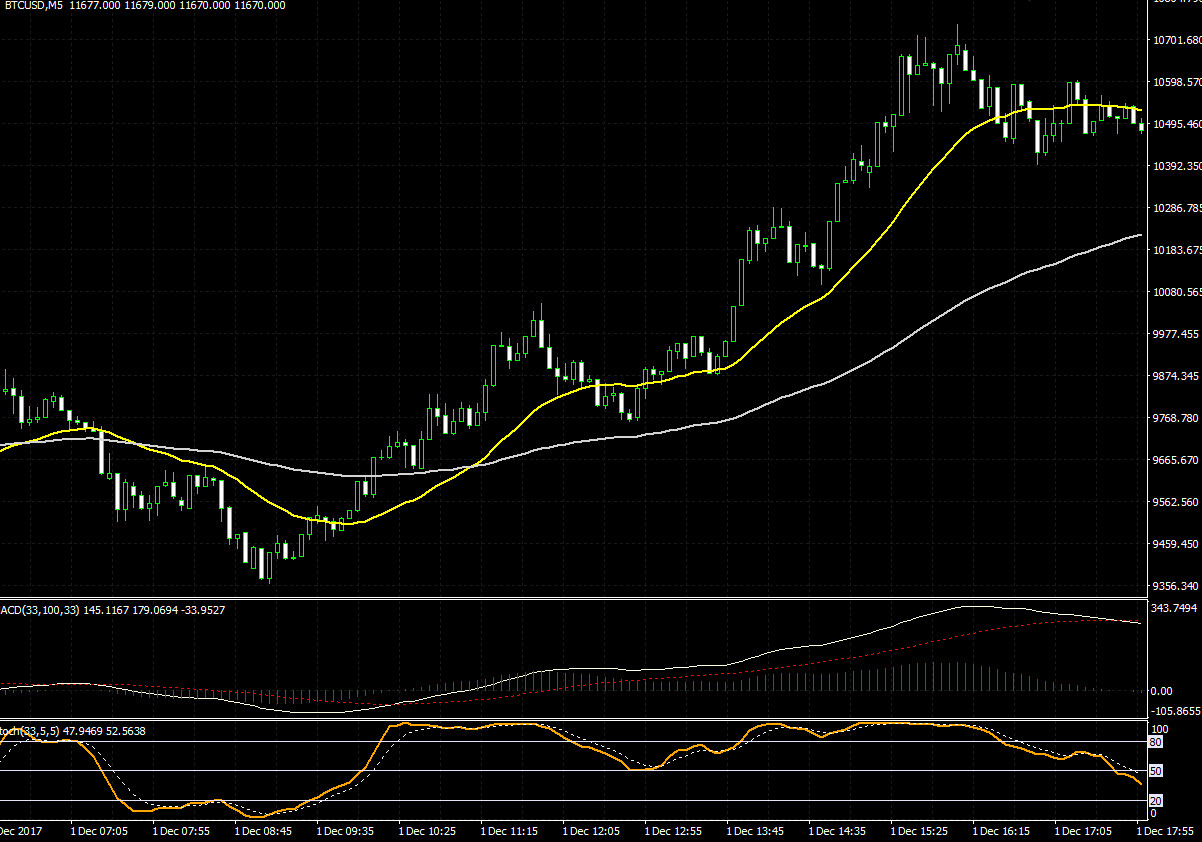
Averages can be a great help in trending markets. I do not like to trade based on them (I use them only as additional information) but we are talking here about Bitcoin ;).
You can use set of 2-3 averages like
- 100 and 200,
- 50 and 200,
- 50, 100, 200
Like in the example below:
Another option is to put more averages:

The alternative is to use Rainbow:
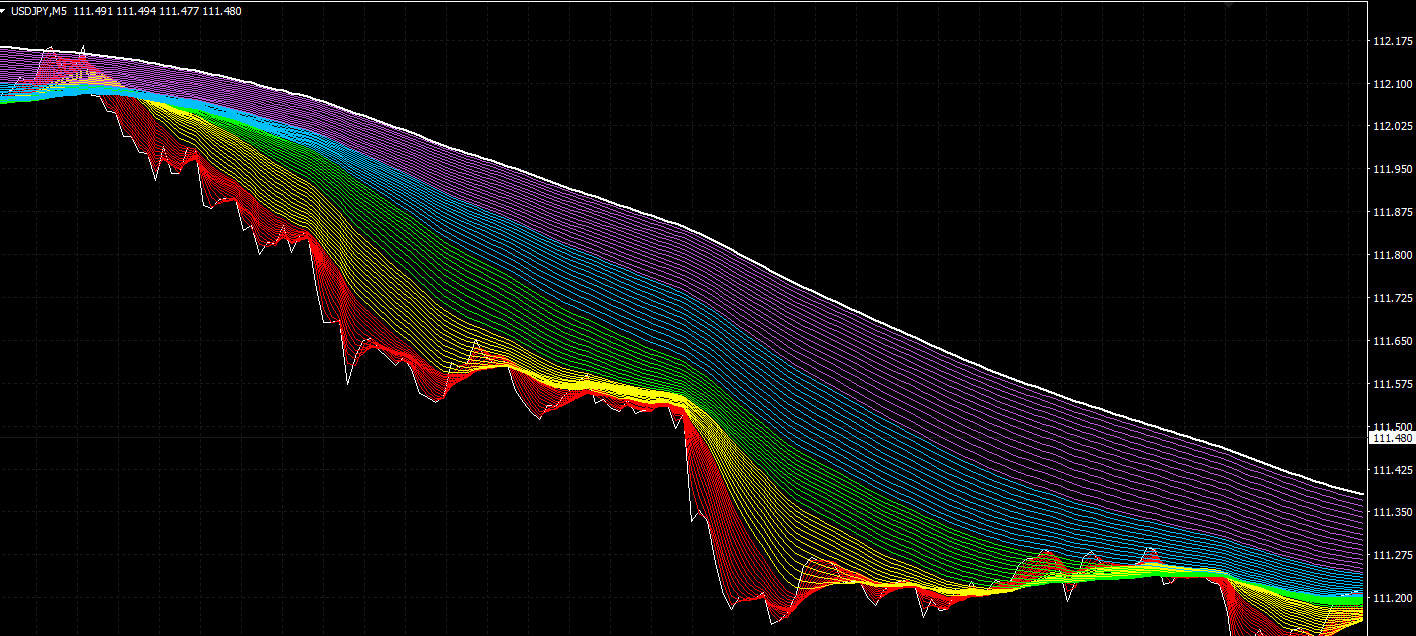
Or GMMA:

All these setups with averages can help you to go with a trend and to find possible support and resistance areas. Which one is best for you? Test it.
Trailing stop loss
Trailing stop loss is a great strategy. It allows you to follow trend easily. When you are in profit, you can hold to the trend for a longer period and stop loss line is clear.
I like to join trailing stop loss with other tools which helps me to verify the current trend. In the example below you can see trailing stop joined with Bollinger Bands and 100 average on 5m Bitcoin chart:
 From the start, it was clear where to enter and where to close. Settings for this trailing stop are:

Another idea is to join trailing stop loss with averages. They can work both as support/resistance and trend indicator. Thanks to them you have better chances to invest in the right direction.
The best way to trade with trailing stop loss is to trade with the trend. Especially on lower time frames. You just have to wait for best setup of averages and trailing stop loss. Below Bitcoin again, 5m chart:

Settings for this trailing stop: Take a closer look at two charts above. You can see that both are 5m Bitcoin. On both, with trailing stop loss you could catch most of the 1000$ move. All that on a 5m chart! That is the true power of trading with trailing stop loss.
You can download templates from examples here:
Remember that you also have to install trailing stop loss. You can download it here:
ATR trailing stop loss (Chandelier Exit) – Metatrader download
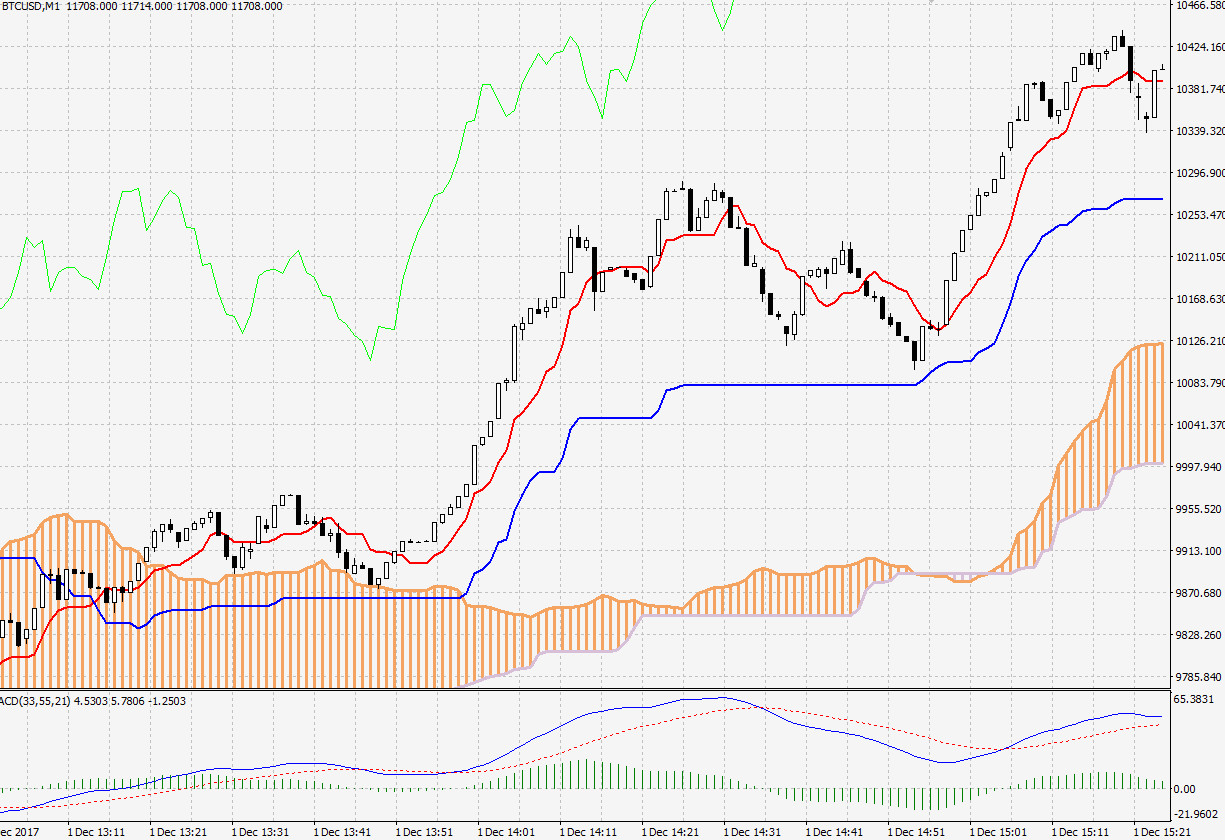
Ichimoku
Ichimoku is an old trading indicator which works great in trending conditions. You can also use it with Bitcoin trading. My advice would be to change standard settings to the ones below:
 They are longer than standard Ichimoku settings. Thanks to that you will get a better picture of the current situation.
You can use it on a 1m chart like below:
 Or any chart you like. Cloud, Kijun, Tenkan… they all work the same across the board.
Download Ichimoku template here.
Fibonacci
Time frame
Fibonacci trading works on every time frame but for most traders, it is better to trade on the higher time frame. Especially when you trade Bitcoin or another crypto. Trends are strong here and you can catch bigger moves on higher time frames. Few examples below.
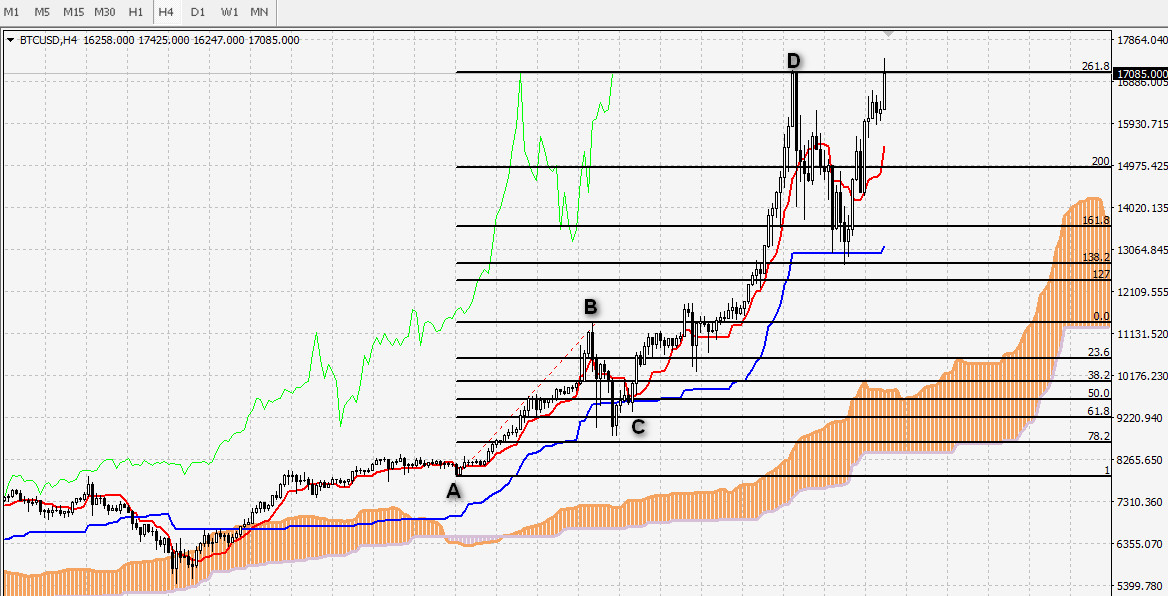
The 4-hour time frame of Bitcoin and simple ABCD trade:

The daily time frame of Bitcoin:

The weekly time frame of Bitcoin:

As you can see, on every one of them you can use Fibonacci to catch big moves.
Of course, Fibonacci works also on lower time frames, even when you trade Bitcoin. Example of 1-minute Bitcoin time frame:
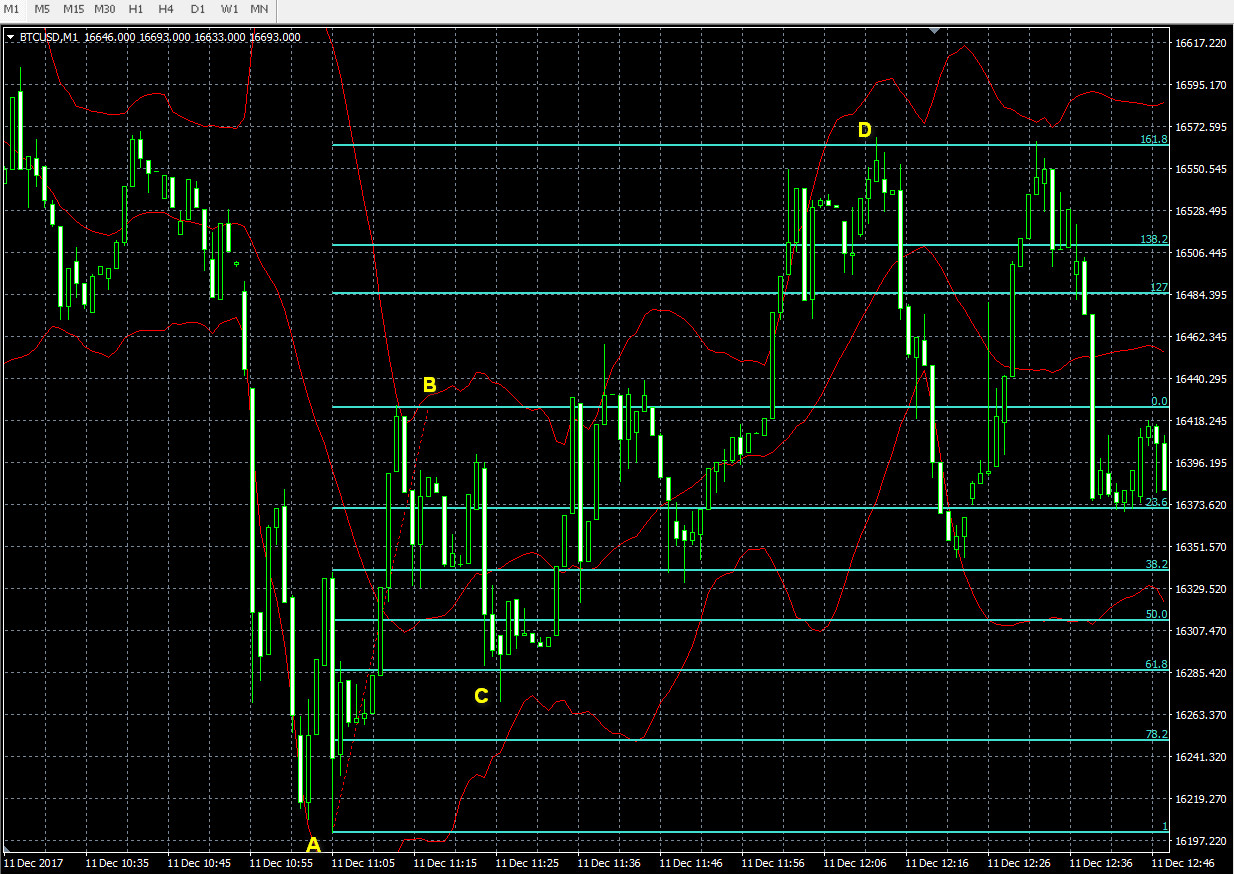
You can see that it works great even on time frame as low as 1-minute. Read more about day trading bitcoin here.
Fibonacci retracement
You can use standard retracement lines:
- 23.6%
- 38.2%
- 50%
- 61.8%
- 78.2%
We use them to spot ABC moves:

Read more: how to configure Fibonacci retracement and extension in Metatrader.
Fibonacci extension
When it comes to extensions, you can use more lines. I stick to most basic ones:
- 127% extension
- 138.2% extension
- 161.8% extension
- 200% extension
- 261.8% extension
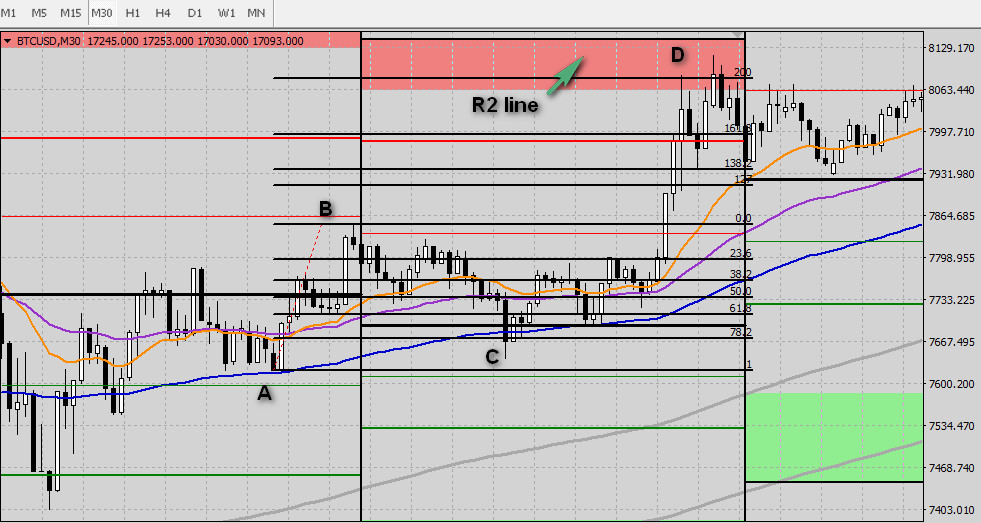
Just like on the chart below:
 You can add more like 238.2%, 300%, 361.8% and so on. I prefer to have a cleaner chart that is why I do not put all of them.
Or look for harmonic setups.
MACD
MACD oscillator works great when we have trending markets. You look here for two things:
- are signal lines above or below 0 line
- cross of signal lines
If lines are above 0 line that means that we have better chances for a move up and we look to go long. You open a trade after a cross of signal lines:
Pivot Points
Pivot Points are great because they show you where are potential support and resistance areas. You can build a good strategy with that information.
There are many Pivot indicators for Metatrader. I recommend using that one.
When you add Pivot indicator to the chart, you have to decide on which period it will be calculated. Standard is daily but there are many others to choose from:
 Do Pivots work on Bitcoin chart? Of course. Just like with any Forex pair, it gives us potential support and resistance levels. Below 15m Bitcoin chart with daily Pivots:
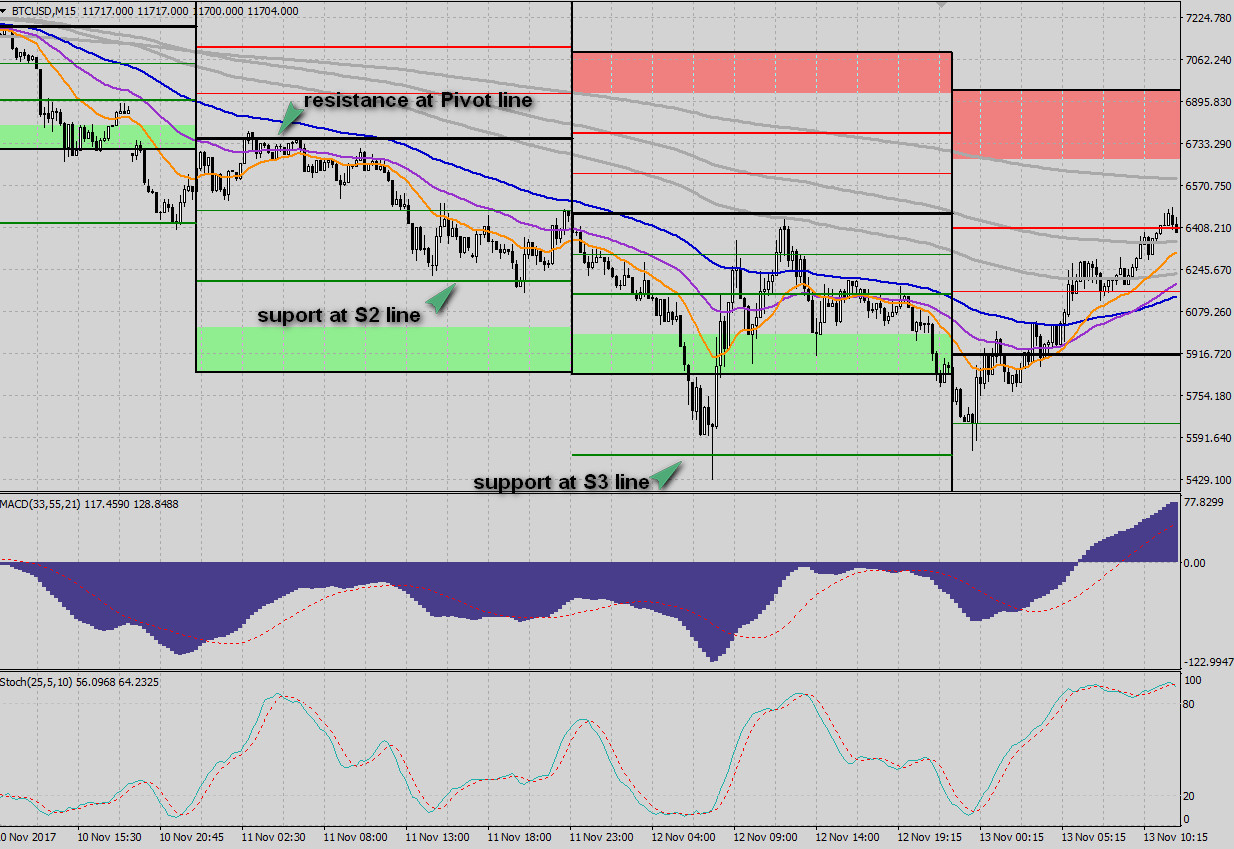
If you trade on 1m or 5m time frames then it can be a good idea to trade with Pivot Points calculated on 1h or 4h. You switch that in settings window which I showed you in the beginning. Below you can see 1m time frame. See how Pivot works when they are calculated on 1h (so every hour we have new Pivot lines). It is clear that Bitcoin price reacts with these levels which can be support or resistance for the Bitcoin price:
If you trade on 5m time frame then it is a good idea to try Pivot Points based on 4-hours period (every 4 hours we have new Pivot lines plotted on chart). Again, Bitcoin price finds support and resistance on these lines. Below 5m Bitcoin chart with Pivot Points plotted every 4 hours:
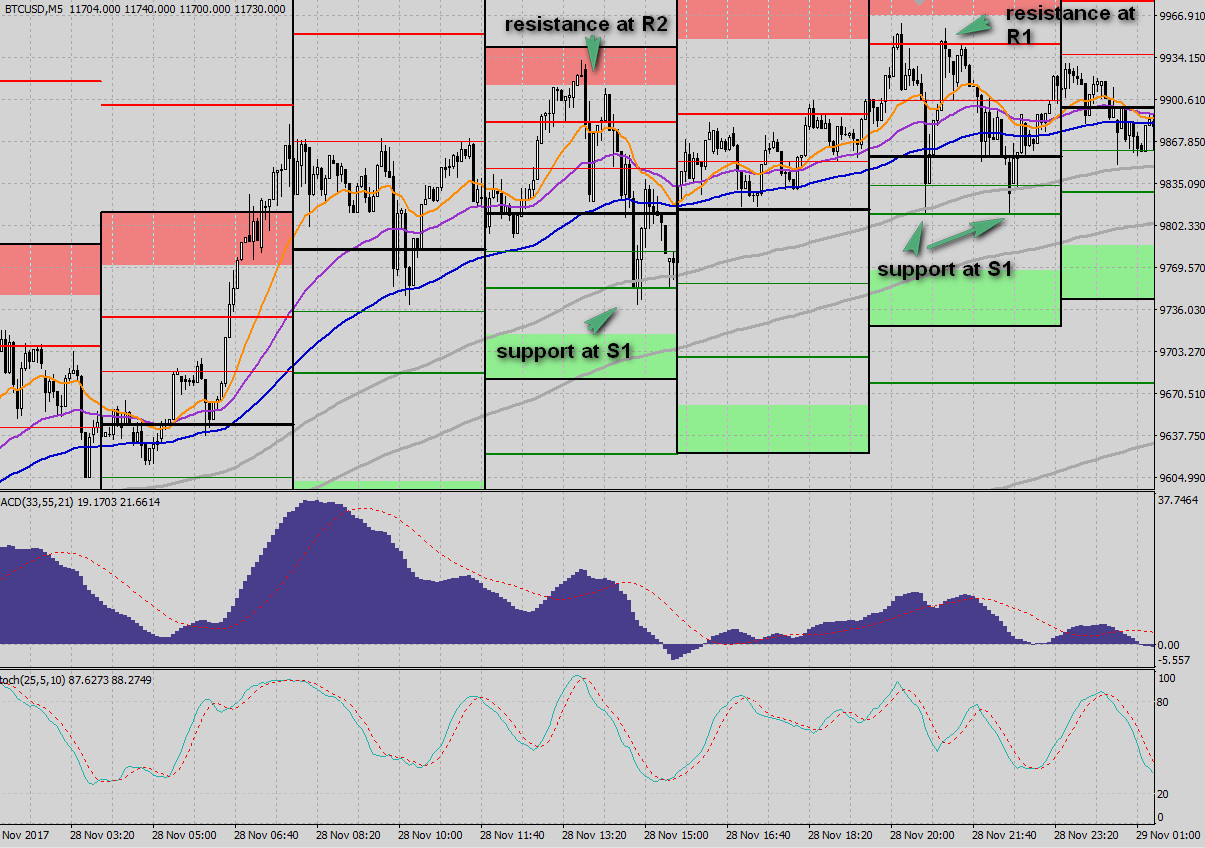
On charts above you can see that I joined Pivot Points with MACD, Stochastic and averages. You can use other technical tools. I just like to have a confirmation of trend and signal to open and close position. I think that setup above works just fine.
Download template from examples here.
Remember that you need to install pivot points from here.
Trailing stop loss, Fibonacci, and Bitcoin
The plan can be like this:
- you trade with ABCD pattern
- when a price goes near your target (extension line) you close part of a trade (take profit)
- move stop loss higher
- let the rest of trade run with a trend
Like in the example below:
 Pivot lines, Fibonacci, and Bitcoin
If you decided to trade on lower time frames (1h and lower) then it is a good idea to combine Fibonacci with Pivot lines. Below you can see how daily Pivot lines and extension lines helped to select the best exit point:
More about trading with pivot points here.
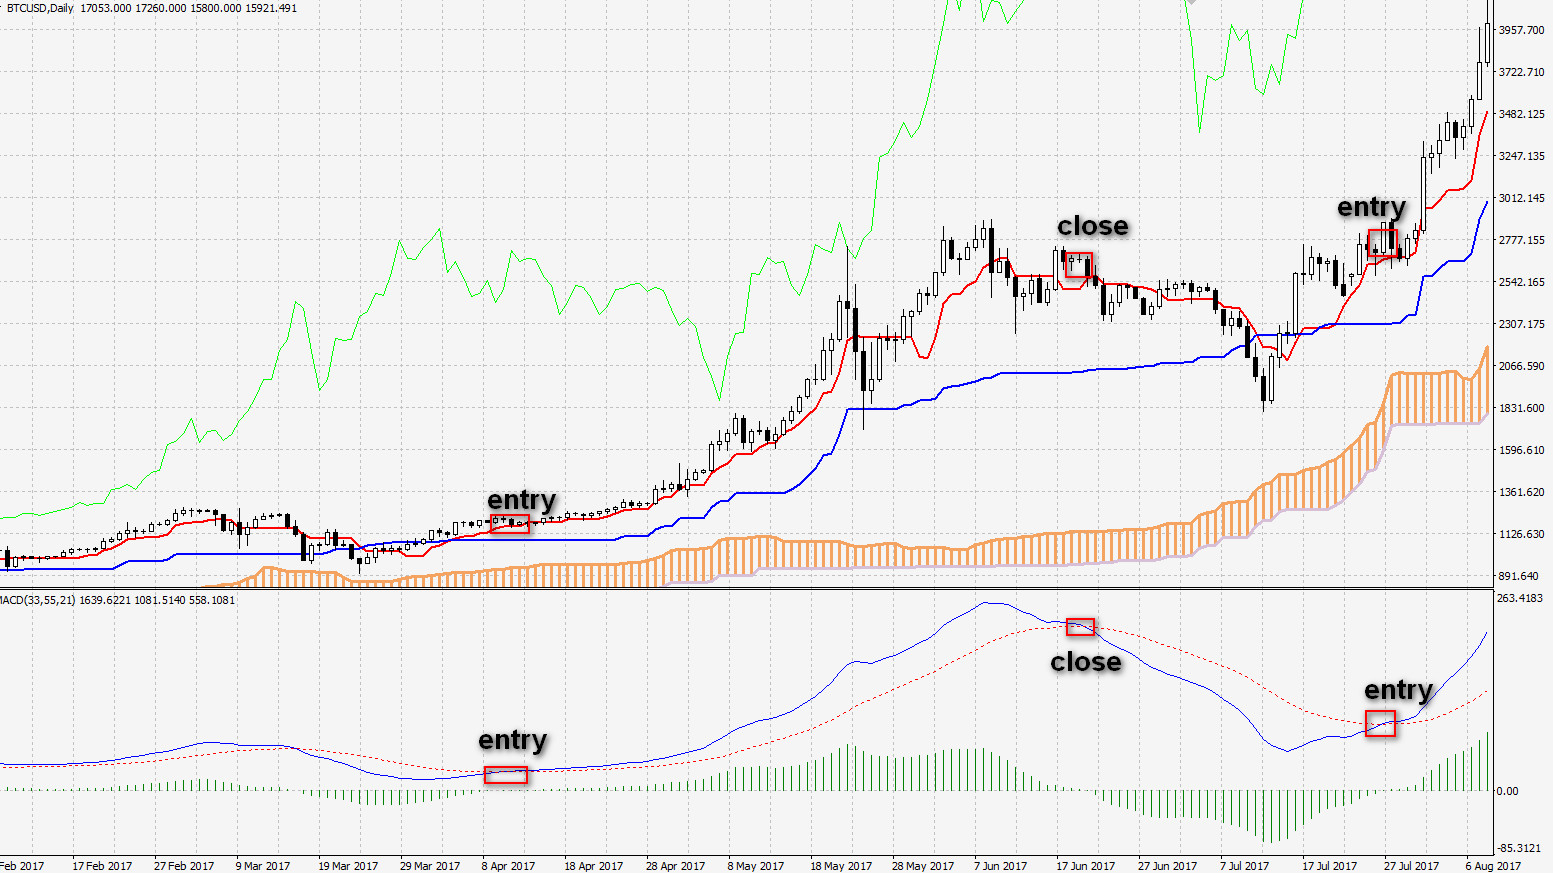
Ichimoku, Fibonacci, and Bitcoin
Ichimoku works best in trending condition. Bitcoin is trending so it is a nice combination of Fibonacci and Ichimoku. You use Ichimoku as a trend indicator. When you see – like below – that trend is up, you look for proper ABCD setup:
You can also use Ichimoku as a signal to enter or exit a trade. For example, a classic break from the cloud would be a good signal:
 I would recommend going with longer settings like below:
It will give you a much better picture of current market conditions.
More about trading Ichimoku here.
Day trading on Bitcoin
Selecting best time frame
It depends on your trading style, but 1-m time frame may not be the best choice:
 The action here can be choppy. In my opinion, it is much better to try to catch swing moves and breakouts on 5m, below 5m chart of Bitcoin:
You can try 15m, but in my opinion, this time frame is better to catch swings which can last for few days. Below 15m chart of Bitcoin, white vertical lines separate single days:

You have to try it with your trading strategy. If you still want to trade 1m chart then I still believe that EUR/USD will be a better choice.
The risks of day trading Bitcoin
You can day trade Bitcoin, but there are some risks which you should be aware of:
Price can change in few minutes
So many people think that Bitcoin goes only up. They are wrong. When you check lower time frames you can see that Bitcoin can go few hundreds of dollars up or down in few minutes. Just like that:

Or that:

Of course, if you have a trade opened in a direction of that move then great for you. There will be times when this price will go against you so proper position management is super important here.
It is hard to find broker with low spread for day trading
Bitcoin is right now around 10,000$. Because of that price spread is rather wide. It is hard to find a good broker with low spread to day trade Bitcoin.
Unexpected news
When you trade normal forex pair you have a calendar of economic publications. You know in advance when some major economic data will be published.
With Bitcoin it is a different story. There are many unexpected news from central banks banning Bitcoin etc. Because of that price of Bitcoin can go down in a short time:

As you see, you should be careful. I showed you that normal trading tools work just fine on Bitcoin. You can trade it like any other pair. But there are some risks and you should be disciplined.


