
I spotted interesting situation on DAX in August (read full story here).
Quick reminder – for many months DAX was in a downtrend. It went down to around 8700 points. Then we had signs that something is changing. First good sign came on weekly timeframe when DAX broke above resistance line and Ichimoku cloud. I posted this screen in August (weekly chart below):
I like signals like this from Ichimoku on higher timeframes. They are pretty accurate.
After that breakout we saw another range move (weekly chart below):

Hard condition to trade on lower timeframes. On higher timeframes you have to be patience, as always :). So finally, after few months with help of S&P500 (new records there) we saw a strong move up (weekly chart below):

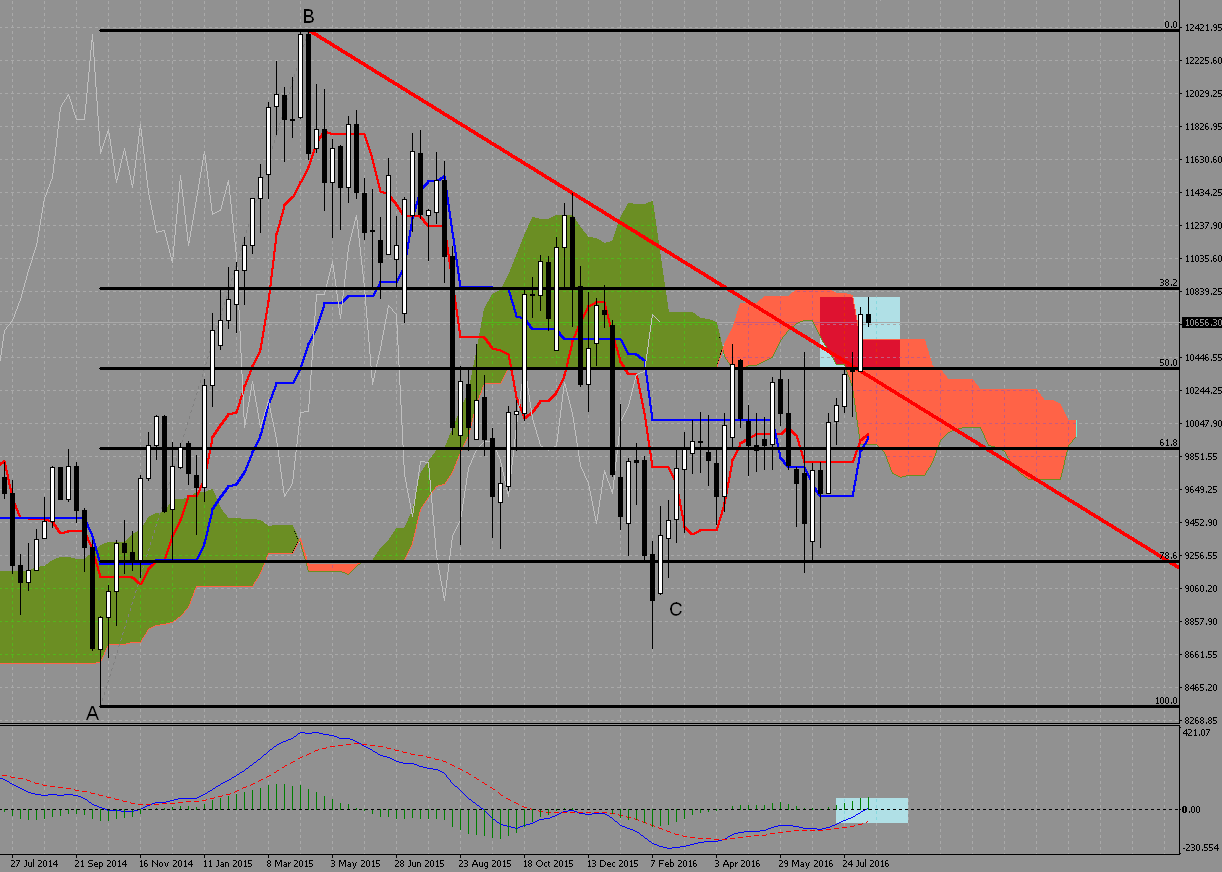
Looks that bulls are back in action. Question is, where are possible targets for this move up? Let’s put Fibonacci extension on DAX weekly chart:

You can see that first and obvious resistance is at B (recent hight). If bulls manage to go higher than B then we will be looking at 127% or 138.2% extensions as possible target for buyers. Of course, it may take some time but this is for sure an interesting situation and good conditions for bulls.
If bulls fail to move DAX higher than logical stop level would be somewhere below big candle from last week.


